LUNARTULIP ALPHAMAP / RESEARCH NOTE #001
The Incremental Network Test
A technology graph can organize an investment universe. The harder test is whether its connections improve the ranking of future returns.
The most useful result from our latest AlphaMap experiment is a distinction: semantic affinity is measurable; incremental return prediction still has to be earned. We reconstructed company–technology networks across the AI stack, converted them into stock signals, and tested them repeatedly over 2025–2026. The raw neighborhood-return relation largely disappeared after familiar market and disclosure controls.
This is a full graph-factor experiment. It starts with company–concept associations, moves through bipartite projection and centrality, and ends with cross-sectional tests and portfolio accounting. The current evidence does not establish predictive network alpha.
Start with the graph, then ask what it adds
Our frozen cohort spans Memory, Compute, Networking, Power/DC, Cloud/Models and Applications. The network uses 70 technical concepts in dated SEC disclosures. Companies connect through shared concepts, with common concepts receiving less pairwise weight. It therefore connects firms across the six layers rather than treating the layers as separate baskets.
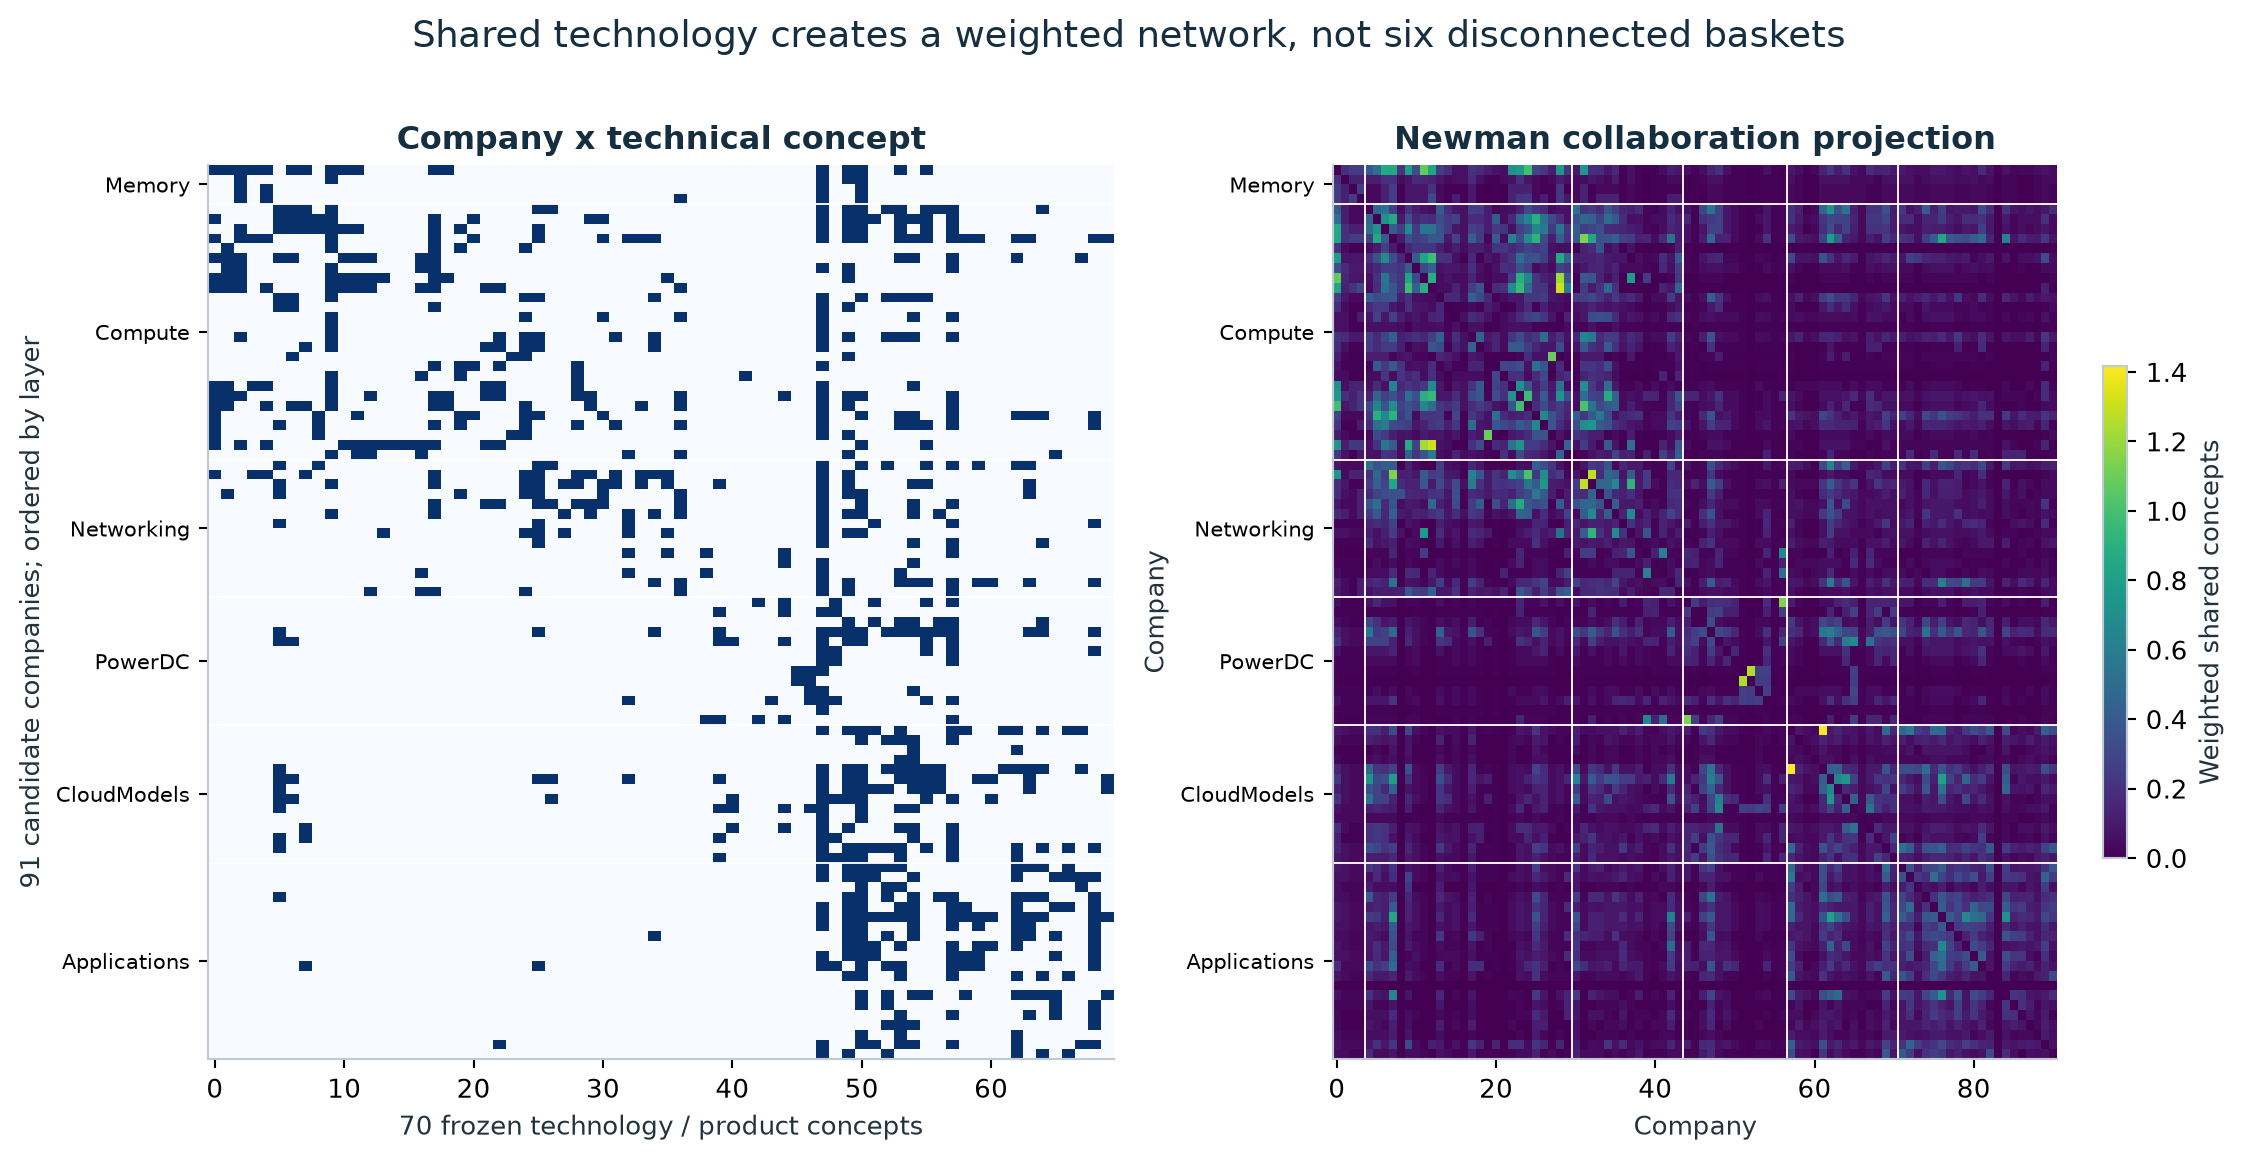
The projection contains a revealing identity: a company’s weighted connection strength equals its count of concepts shared with other companies. Breadth can masquerade as centrality. We therefore control concept breadth and disclosure length, alongside layer, momentum, beta, volatility, liquidity and available dated capitalization proxies.
From 0.078 to 0.007
The primary signal averages neighbors’ recent returns, removes these controls, and predicts the focal company’s next 21-session return rank. Its mean weekly Rank IC falls from 0.078 before controls to 0.007 after controls. The controlled 95% interval is −0.040 to +0.055. Even the raw estimate is imprecise. None of six direction-fixed graph signals survives the primary-horizon multiple-testing correction.
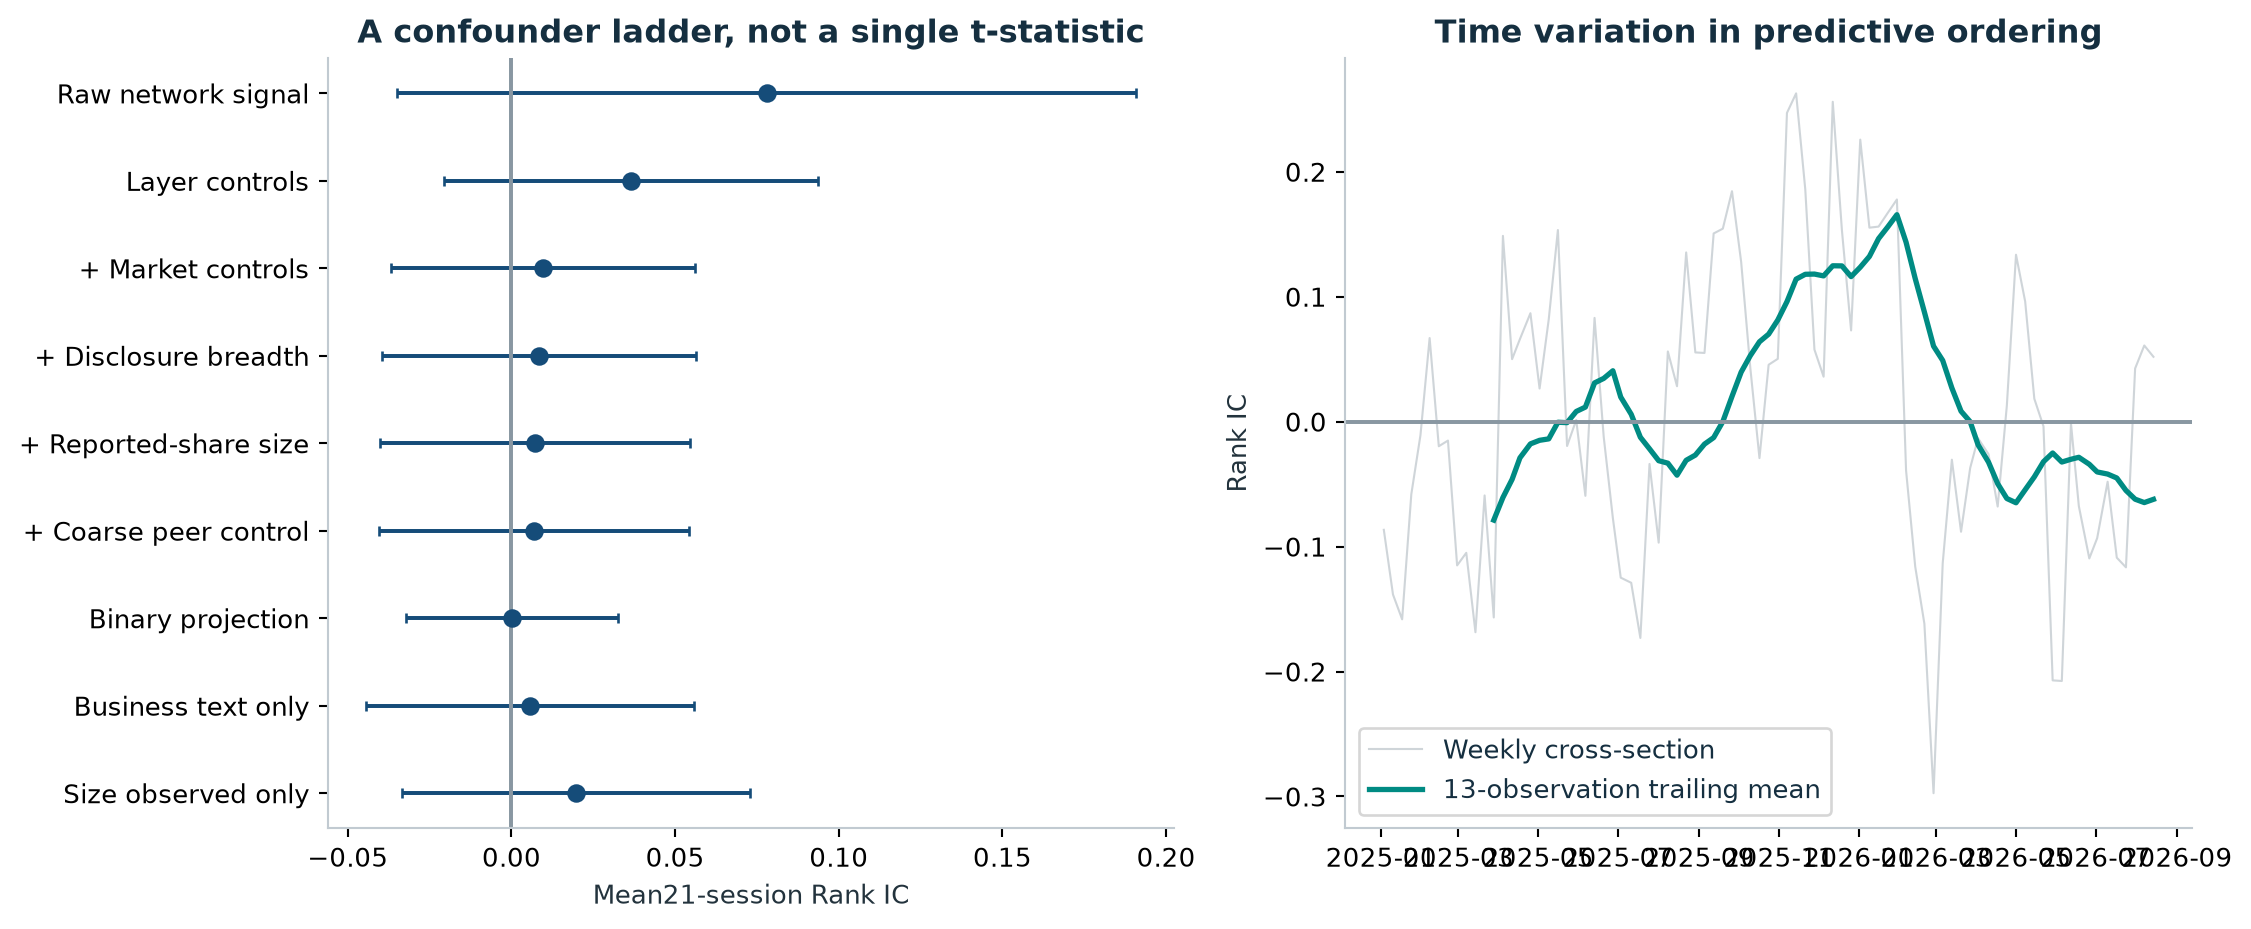
We also test residual Katz, centrality changes, brokerage and interactions with momentum. Monthly characteristic regressions, factor-risk regressions, alternative horizons and source-scope sensitivities do not establish a predictive premium in this sample. No signal direction is reversed after seeing returns.
Portfolio construction is part of the experiment
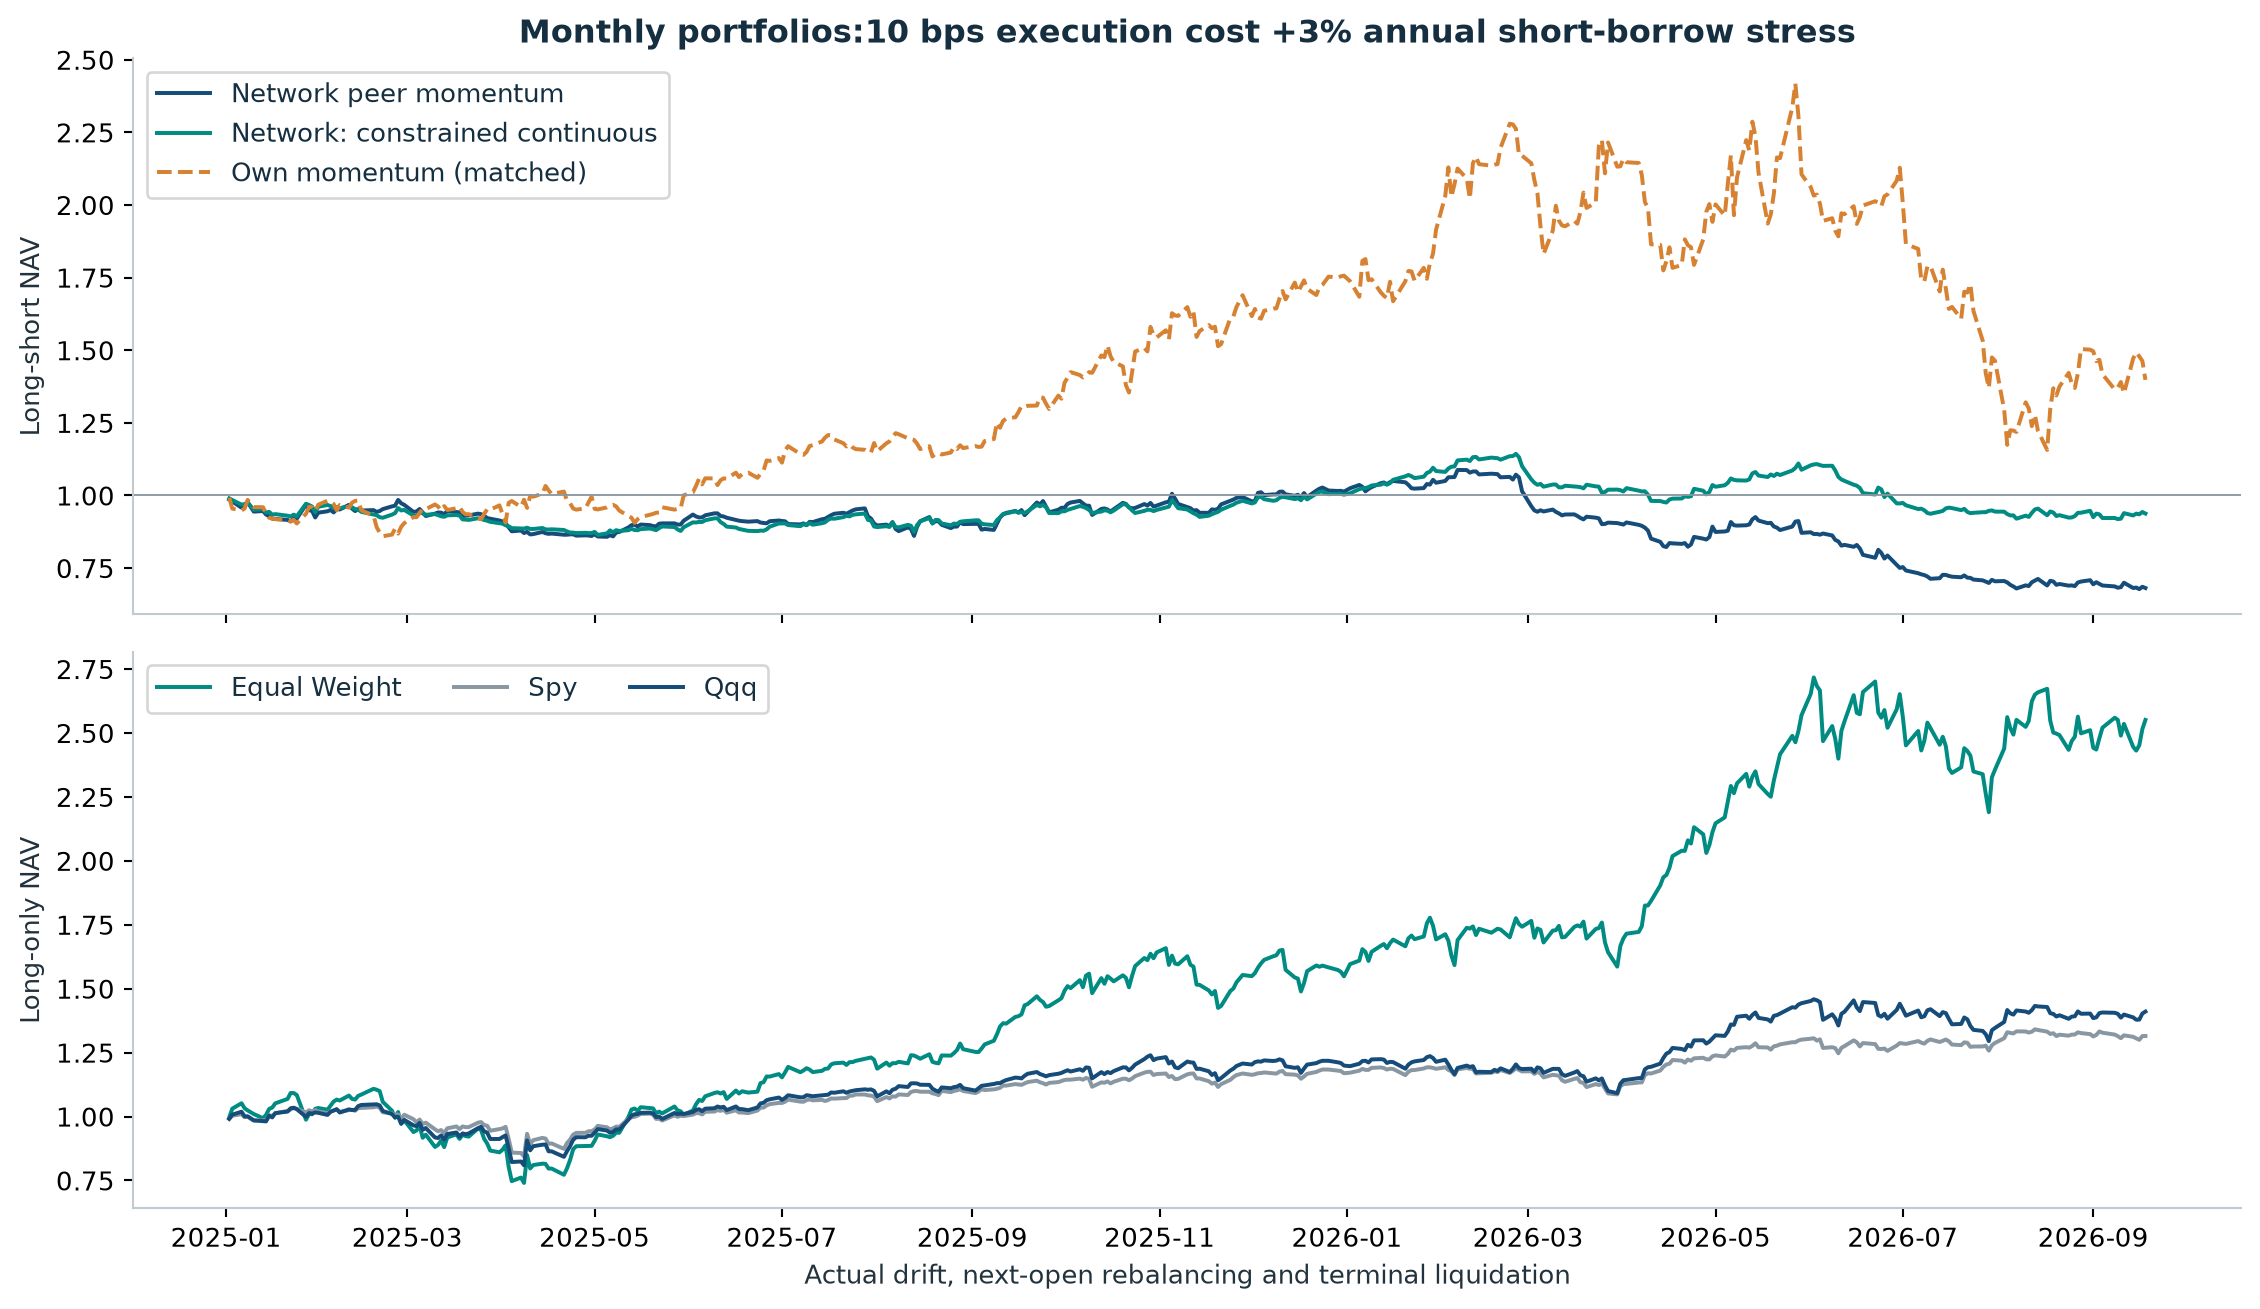
A tail portfolio is not equivalent to a neutralized score. At 10 basis points per dollar traded and a 3% annual short-borrow stress, the primary quintile long-short portfolio returns −31.9%. A continuous portfolio with concentration caps and control-neutral targets at rebalancing returns −6.2%. Both results are negative. The difference shows why graph-factor evaluation needs positions, costs and exposures—not just a ranking correlation.
What would make the next graph economically stronger?
A semantic link says two firms discuss related technology. A transmission channel must say more: who buys, who supplies, where capacity binds, how a state changed, when the evidence became knowable, and which security captures the effect. The next test should propagate dated, economically signed innovations along those identified links and compare the result with the disclosure-affinity baseline.
That is a falsifiable research agenda, not a positive result already hidden in this study. A richer graph should earn its complexity through incremental prediction.
The limits travel with the finding
The 91-name cohort was selected with hindsight; 90 names have usable prices. Historical document publication, actual acquisition and reconstruction times are kept distinct. This is a historical reconstruction, not a native-forward or survivorship-free record. Annual disclosures update slowly, source semantics remain imperfect, and market prices are current-vintage.
Our planned degree-preserving null also exposes a support constraint: only 95 of 199 rewired panels preserve every required test date. Those common-support draws are descriptive; the original planned p-value is withheld. Stable overall rankings likewise do not guarantee stable portfolio tails.
The research contribution is an incremental-network benchmark: dated graph inputs, explicit confounders, repeated prediction tests and transparent negative results. It gives the next economic-state experiment a standard to beat.
Read the published working paper and methods package →
Author ORCID: 0009-0000-4821-8007. Published as version 2.0 under DOI 10.5281/zenodo.22862923. The Zenodo artifact is licensed under CC BY-NC 4.0; website and database use terms are stated separately. The earlier coarse-projection study is now displayed as AlphaMap Research Note #000 and remains archived at 10.5281/zenodo.22846355.