
 Model figure / p.8
 Data and sources / p.16
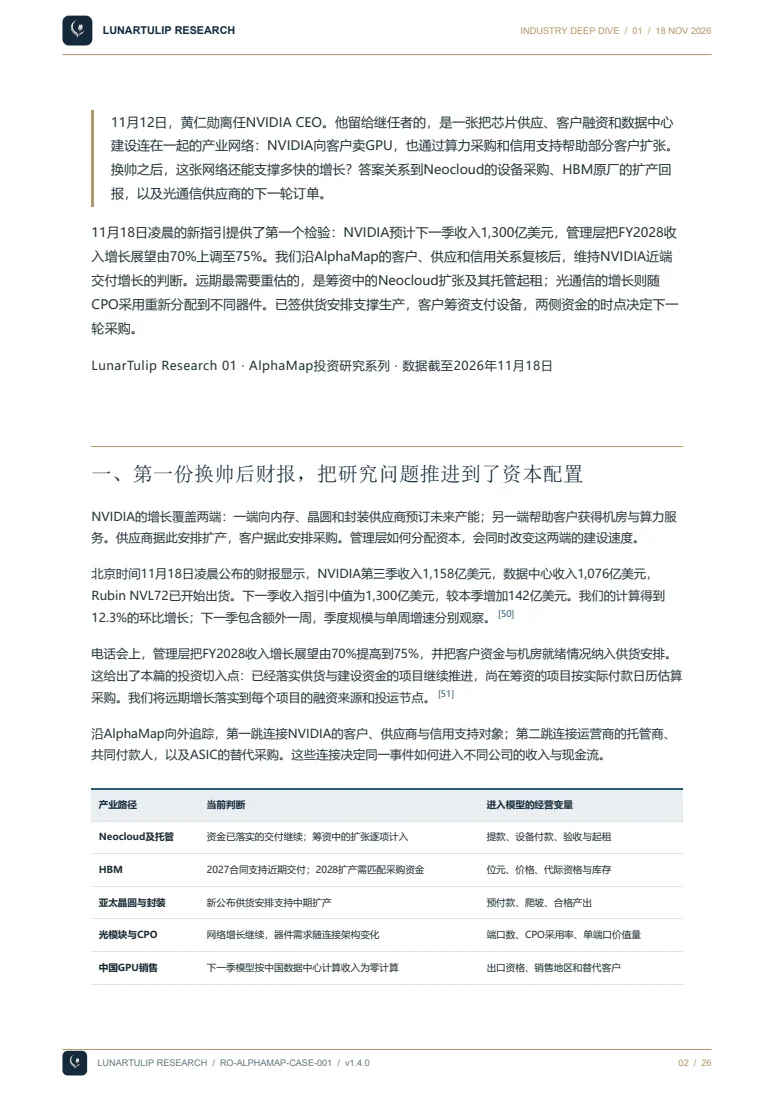
On November 12, Jensen Huang stepped down as NVIDIA CEO. His successor inherits a network linking chip supply, customer financing and data-center construction. NVIDIA sells GPUs to customers while helping some expand through capacity purchases and credit support. How much growth can that network sustain after the transition? The answer reaches Neocloud equipment purchases, HBM expansion returns and optical suppliers’ next orders.
The first test arrived with the November 17 results: NVIDIA guided to $130 billion next quarter, and management raised its FY2028 revenue-growth outlook from 70% to 75%. Following AlphaMap’s customer, supplier and credit relationships, we retain a near-term delivery-growth view. The expansion requiring the closest reassessment is Neocloud capacity still raising capital and the hosting leases attached to it. In networking, CPO adoption reallocates component value. Supply contracts prepare production; customer capital pays for equipment. The timing of both determines the next procurement cycle.
LunarTulip Research 01 · AlphaMap investment research · November 18, 2026
1. The first results after the transition put capital allocation at the center
NVIDIA supports growth on both sides of its business: it reserves future memory, wafer and packaging capacity, and helps selected customers secure infrastructure and compute services. Suppliers plan expansion against these arrangements; customers plan procurement. Capital allocation influences the pace of both.
Fiscal Q3 revenue reached $115.8 billion, including $107.6 billion from Data Center, and Rubin NVL72 began shipping. The $130 billion Q4 midpoint adds $14.2 billion, or 12.3%, to the quarter’s revenue. Q4 includes an extra week, so quarterly scale and weekly growth require separate treatment.[50]
Management raised its FY2028 growth outlook to 75% from 70%, incorporating customer capital and facility readiness into allocation decisions. We therefore retain delivery growth for projects with procurement and construction funding in place, and assess projects still raising capital against their payment calendars.[51]
The first AlphaMap hop identifies customers, suppliers and supported counterparties. The next reaches hosts, shared economic payers and alternative ASIC procurement. Those relationships connect the same event to different company cash flows.
| Industry path | Current assessment | Financial-model input |
|---|---|---|
| Neocloud and hosts | Funded delivery continues; assess unfunded expansion project by project | Draws, equipment payments, acceptance and lease starts |
| HBM | 2027 contracts support delivery; 2028 expansion needs procurement funding | Bits, prices, generation and inventory |
| Asian manufacturing | Announced agreements support planned expansion | Prepayments, ramps, qualified output |
| Optics and CPO | Networking expands; component demand changes with architecture | Ports, adoption, qualified supply value |
| China compute sales | Q4 uses zero China Data Center compute revenue | Licensing, region and alternative orders |
| Open models | Product investment continues | R&D, adoption and compute procurement |

Research judgments as of November 18, 2026. NVIDIA FY2028 and calendar-2028 HBM scenarios use different periods.
2. CoreWeave’s revenue support reaches its hosts through a payment calendar
NVIDIA’s specified residual-capacity purchase agreement with CoreWeave had an initial value of $6.3 billion and runs through April 2032. NVIDIA buys eligible residual capacity after contractual delivery and service conditions are met. That arrangement supports specified future receipts, a source operators can present to lenders.[2]
Construction precedes operating receipts. CoreWeave generated $5.638 billion of operating cash flow in the first nine months and spent $23.558 billion on cash PP&E and software, a 23.9% coverage ratio. Net financing of $21.346 billion funded much of the expansion. Management expected $9 billion of customer prepayments and deposits over the following three months; receipt timing affects the next equipment-payment window.[3][5]
Our illustrative payment stress delays 20% of the $9 billion, reducing near-term receipts by $1.8 billion. With $1 billion of immediately available substitute capital, $800 million requires further financing or payment extension. Sufficient borrowing preserves procurement while interest reduces equity cash. Each additional 100 basis points on $1 billion adds $10 million of annual interest. Readers can replace these assumptions.[3][5]
The new CFO commentary clarifies sequencing: Neoclouds secure purchase financing, deploy and operate capacity, then obtain acceptance before the relevant support takes effect. In Q&A, management said this mechanism was already in place. We retain project-by-project funding and procurement assessments, anchored to capital available at payment dates.[51][52]

3. CORZ is diversifying contracted capacity; current receipts remain concentrated
One hop beyond CoreWeave reaches Core Scientific (CORZ). At September-end, all colocation revenue came from CoreWeave, which represented approximately 84% of group nine-month revenue. Of CoreWeave’s 590 MW, 485 MW was billable, or 82%. Billing the remaining 105 MW affects incremental hosting revenue.[6][7]
Future contracts add 377 MW leased directly by AMD and 152 MW leased by another Neocloud with specified conditional AMD credit support. CoreWeave represents about 53% of the combined approximately 1,120 MW. The newer leases had yet to commence; customer diversification reaches revenue as the expected 2027–2028 deliveries enter service.[6][7][49]
Our near-term CORZ cash-flow assessment therefore remains centered on CoreWeave’s payment and credit terms. Revenue from the additional 529 MW follows each lease’s financing, construction and commencement. For an eligible lease at the 50% credit cap, $100 of eligible monthly fees produces $50 of current receipts. With the fee held constant, receipts rise to $100 after credits expire. Project debt terms then govern interest, amortization and reserves.[7][8]
Other sponsors create alternative buildout paths. Google supports specified Akela leases; Broadcom participates in the $63 billion equipment-SPV financing arrangement connected to Anthropic XPU and networking purchases. We retain the instrument and closing conditions for each contract and assess GPU and ASIC procurement alongside one another.[11][39]

4. Memory and packaging have supply arrangements; incremental demand needs a payer
At October 25, supply and capacity commitments rose from $279 billion to $390 billion, a $111 billion increase, or 39.8%, primarily for multiyear memory procurement. These pre-transition arrangements support suppliers’ capacity planning. We separately track supply commitments that prepare production and customer financing that pays for equipment.[52]
The November 17 supply-chain announcement extends across Asian substrates and packaging. Kinsus plans to expand dedicated NVIDIA ABF capacity “by more than 3.5x over current levels,” targeting additional capacity in Q3 2028. Amkor’s previously announced agreements totaling nearly $3 billion include prepayments. NVIDIA’s multibillion-dollar support for SPIL targets expanded dedicated advanced packaging by mid-2029.[53]
We retain a contract-supported 2027 HBM delivery view. Micron said agreements cover the vast majority of calendar-2027 HBM bits with significant year-over-year pricing increases. Qualified output, buyer volumes and transaction prices determine the return on 2028 expansion.[20]
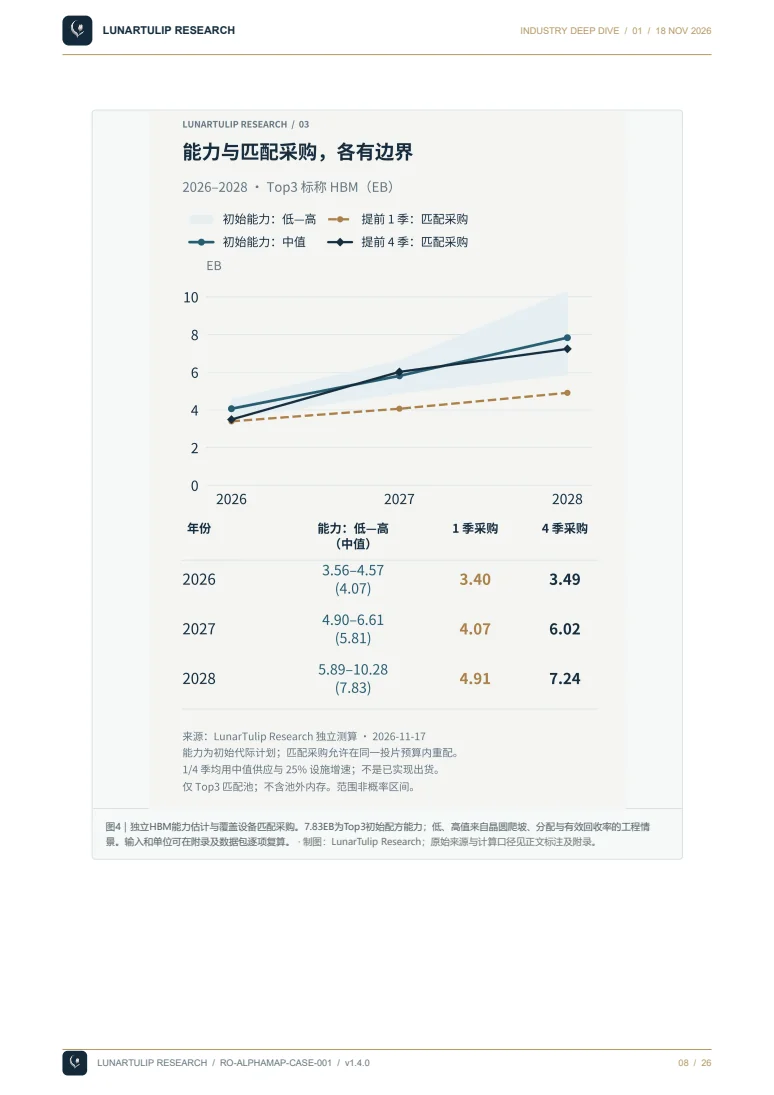
Our independent supply model applies annual wafer processing, effective output and generation mix to estimate 7.83 EB of initial-mix 2028 capability from the three major suppliers, with engineering scenarios of 5.89–10.28 EB. The full desired-device path uses about 11.10 EB; ASICs contribute approximately 75% of incremental device units from 2026 to 2028. Customer mix and qualified generations shape absorption.[25][26][27][28]
We first assess HBM supply with agreed pricing, volumes and customer qualification, then evaluate additional lines. Actual purchase prices and allocated capacity inform NVIDIA’s sourcing position; procurement funding across both GPU and ASIC customers informs industry demand.

5. The 2028 HBM procurement difference needs buyers to finance inventory
Buyers fund equipment between procurement and commissioning. Holding facility-IT growth at 25%, mid-case device power, opening inventory and a one-quarter physical lag constant, we compare procurement one, two and four quarters ahead. Covered-device HBM in 2028 is 4.958, 5.212 and 7.311 EB respectively; year-end installed AI-system IT is 99.7 GW in all three cases.[36]
Moving procurement from one quarter to one year ahead adds 2.354 EB, or 47.5%, to annual purchases and 4.433 EB to year-end uninstalled-device HBM. Assuming $30,000 per GPU and $10,000 per ASIC, the longer policy ties up another $217.4 billion of year-end accelerator capital. Buying early converts future installations into current orders and puts the inventory capital on the buyer’s balance sheet.
The calculation identifies the funding scale behind distant HBM growth. IREN’s financing for its Microsoft project draws in tranches against delivery milestones and conditions. Such structures link receipt schedules to milestones. Customer advances, drawable facilities and equipment-payment dates therefore belong in procurement analysis.[14][15]
Configuration changes are a separate experiment. Holding the same 2028 device cohort constant, the applicable Ultra engineering configurations and MI450X/MI455X selection reduce HBM from 11.42 to 11.10 EB, or about 0.32 EB and 2.8%. The fixed-device experiment measures configuration; the procurement-window experiment measures inventory timing and capital. Each informs supplier absorption through its own mechanism.[31][32][33][34]

Test the same thesis under different conditions
All 27 combinations are full runs of the frozen model; no front-end interpolation. Memory/area are fixed at mid values and physical lag at one quarter. The 25% facility path is accelerated. Outputs cover the modeled devices and do not carry calibrated industry probabilities.
6. CPO enters production networks; optics needs a per-port value model
The call reported CPO operating in production networks. Management disclosed more than $21 billion of quarterly networking revenue, volume production of CPO scale-out, and Lambda’s first production deployment connecting more than 10,000 GB300 GPUs. We retain a networking-buildout view and bring component substitution into optical suppliers’ revenue assumptions.[51]
For the same set of scale-out optical connections that can use either CPO or pluggable solutions, supplier revenue equals delivered ports × architecture adoption × qualified share × supply value per port. Cluster expansion and rising CPO adoption can produce different order growth for the two architectures.
Our normalized example increases that comparable set of delivered ports by 50% and raises CPO share from 10% to 30%, holding share and per-port value constant. Pluggable-related ports rise by 1.5 × 70% / 90% − 1 = 16.7%; CPO ports rise by 1.5 × 30% / 10% − 1 = 350%. Company revenue follows its actual component perimeter, qualification and pricing.
We remain constructive on network infrastructure activity and separately estimate pluggable modules, optical engines and other supplied components. Continued CPO adoption allocates part of incremental interconnect value to qualified suppliers.
Normalized sensitivity for the same substitutable scale-out connections. Port growth and adoption shares are explicit assumptions.
7. China sales and open models enter different parts of the demand model
The new guide incorporates China. Quarterly Hopper Data Center sales to China were $2.4 billion; Q4 assumes zero China Data Center compute revenue. Subtracting the $2.4 billion produces a $113.4 billion comparison base. The $130 billion guide midpoint is $16.6 billion, or 14.6%, above that base. Other sales and products carry the next quarter’s expected expansion.[50][52]
We use zero China Data Center compute sales in the next-quarter view and track overseas orders, product mix and delivery dates separately. The board also established a national-security and export-control oversight committee; licenses and regional channels remain company-specific update variables.[54]
The open ecosystem continues through product activity. On November 16 NVIDIA introduced Nemotron for Science, extending open models into scientific workflows. Our inference is that deployable models can broaden GPU use cases; developer adoption, service workloads and procurement test that demand path.[55]
Separating these mechanisms preserves their economic meaning: export eligibility and orders determine regional compute sales, while model adoption influences compute use. Each modifies its own input, with common end workloads reconciled across paths.

Investment view: near-term growth continues; funding and component mix shape the next cycle
At the first earnings checkpoint after the transition, we retain a near-term NVIDIA delivery-growth view, contract-supported HBM deliveries and continued network infrastructure deployment. New guidance, signed supply arrangements and production activity support those judgments respectively.
We assess funded projects against contractual delivery and revenue timing; for expansion dependent on external capital, we reconcile available amounts with equipment-payment dates. CoreWeave receipts connect to CORZ lease commencement and collections; additional HBM capacity connects to customers’ inventory capital; optical revenue connects to CPO component value. These inputs distinguish realized company growth within the same AI spending cycle.
Updates replace specific inputs: actual drawings and advances revise equipment-payment schedules by amount, use and date; acceptance and lease commencement revise hosting revenue; generation qualification and pricing agreements revise HBM absorption; disclosed CPO ports and supplied components revise optical-product revenue.
This is AlphaMap’s contribution in the case: start with a company, identify shared payers, support instruments and second-hop suppliers, then connect each material relationship to a financial assumption. Existing relationships and public supplements retain provenance so readers can follow contracts into inputs, reproduce the arithmetic and form their own investment view.
LunarTulip Research examines how industry changes reach company cash flows through customers, contracts and capital expenditure. This study starts from AlphaMap relationships, adds verified public evidence and independent calculations, and brings financing support, shared customers and alternative procurement into the same investment assessment.
Bring a company you cover and an investment question about shared customers, capacity delivery or financing dependence.
Model, evidence and reproducible appendices
Update and model identity
This edition updates company assessments using disclosures available on November 18 Beijing time. HBM quantities retain independent model 4.1. FY2028 growth is management guidance; calendar-2028 devices, facility growth, procurement policies and future BOMs are separately identified research assumptions.
The model covers high-end cloud accelerators. Top-three initial-mix capability is 7.83 EB in 2028; one-, two- and four-quarter policies produce 4.958, 5.212 and 7.311 EB of covered-device embedded HBM. Other buyers and raw-memory/WIP inventory affect supplier shipments. The globally calibrated procurement path and same-scope adjudication of the separate November 17 external revisions remain open in the research ledger.
The CPO illustration uses delivered ports within the same substitutable scale-out connection set. Kinsus expansion retains the announcement’s wording; it is not converted into wafer or chip output.
Update and model identity
This edition updates company assessments using disclosures available on November 18 Beijing time. HBM quantities retain independent model 4.1. FY2028 growth is management guidance; calendar-2028 devices, facility growth, procurement policies and future BOMs are separately identified research assumptions.
The model covers high-end cloud accelerators. Top-three initial-mix capability is 7.83 EB in 2028; one-, two- and four-quarter policies produce 4.958, 5.212 and 7.311 EB of covered-device embedded HBM. Other buyers and raw-memory/WIP inventory affect supplier shipments. The globally calibrated procurement path and same-scope adjudication of the separate November 17 external revisions remain open in the research ledger.
The CPO illustration uses delivered ports within the same substitutable scale-out connection set. Kinsus expansion retains the announcement’s wording; it is not converted into wafer or chip output.
Update and model identity
This edition updates company assessments using disclosures available on November 18 Beijing time. HBM quantities retain independent model 4.1. FY2028 growth is management guidance; calendar-2028 devices, facility growth, procurement policies and future BOMs are separately identified research assumptions.
The model covers high-end cloud accelerators. Top-three initial-mix capability is 7.83 EB in 2028; one-, two- and four-quarter policies produce 4.958, 5.212 and 7.311 EB of covered-device embedded HBM. Other buyers and raw-memory/WIP inventory affect supplier shipments. The globally calibrated procurement path and same-scope adjudication of the separate November 17 external revisions remain open in the research ledger.
The CPO illustration uses delivered ports within the same substitutable scale-out connection set. Kinsus expansion retains the announcement’s wording; it is not converted into wafer or chip output.
Update and model identity
This edition updates company assessments using disclosures available on November 18 Beijing time. HBM quantities retain independent model 4.1. FY2028 growth is management guidance; calendar-2028 devices, facility growth, procurement policies and future BOMs are separately identified research assumptions.
The model covers high-end cloud accelerators. Top-three initial-mix capability is 7.83 EB in 2028; one-, two- and four-quarter policies produce 4.958, 5.212 and 7.311 EB of covered-device embedded HBM. Other buyers and raw-memory/WIP inventory affect supplier shipments. The globally calibrated procurement path and same-scope adjudication of the separate November 17 external revisions remain open in the research ledger.
The CPO illustration uses delivered ports within the same substitutable scale-out connection set. Kinsus expansion retains the announcement’s wording; it is not converted into wafer or chip output.
Update and model identity
This edition updates company assessments using disclosures available on November 18 Beijing time. HBM quantities retain independent model 4.1. FY2028 growth is management guidance; calendar-2028 devices, facility growth, procurement policies and future BOMs are separately identified research assumptions.
The model covers high-end cloud accelerators. Top-three initial-mix capability is 7.83 EB in 2028; one-, two- and four-quarter policies produce 4.958, 5.212 and 7.311 EB of covered-device embedded HBM. Other buyers and raw-memory/WIP inventory affect supplier shipments. The globally calibrated procurement path and same-scope adjudication of the separate November 17 external revisions remain open in the research ledger.
The CPO illustration uses delivered ports within the same substitutable scale-out connection set. Kinsus expansion retains the announcement’s wording; it is not converted into wafer or chip output.
Update and model identity
This edition updates company assessments using disclosures available on November 18 Beijing time. HBM quantities retain independent model 4.1. FY2028 growth is management guidance; calendar-2028 devices, facility growth, procurement policies and future BOMs are separately identified research assumptions.
The model covers high-end cloud accelerators. Top-three initial-mix capability is 7.83 EB in 2028; one-, two- and four-quarter policies produce 4.958, 5.212 and 7.311 EB of covered-device embedded HBM. Other buyers and raw-memory/WIP inventory affect supplier shipments. The globally calibrated procurement path and same-scope adjudication of the separate November 17 external revisions remain open in the research ledger.
The CPO illustration uses delivered ports within the same substitutable scale-out connection set. Kinsus expansion retains the announcement’s wording; it is not converted into wafer or chip output.
The appendices distinguish disclosures, external estimates and our assumptions. Model 4.1 is frozen. One-, two- and four-quarter procurement policies are shown together without uncalibrated probabilities.
A | From devices and wafers to inventory and cash
| Stage | Calculation and unit | Input status |
|---|---|---|
| Demand | Buyer/platform quantities × product mix → annual SKU demand | Estimated 2026 reference; forward growth, buyer phasing and mix are assumptions [28][29][48] |
| HBM supply | Σ wafers × geometric dies/wafer × Gb/die ÷ 8 × effective qualified recovery ÷ 10⁹ → nominal EB | Issuer construction plans, original research estimates and explicit ramp/recovery assumptions [20][25][26][27] |
| Matching | Generation-compatible supply subject to wafer budgets and BOMs; planned reallocation requires qualification | Recovery already includes qualification. Maximum capacity is not automatically produced. |
| Procurement / installation | Quarterly purchases − installations = uninstalled inventory change; installed stock = prior stock + installations − retirements | 1/2/4-quarter procurement lookahead is distinct from one-quarter physical lag. Opening inventory is fixed; cohorts retain SKU and origin. |
| Logic area | Σ million devices × mm²/device → good logic m² | Compute, I/O and active logic layers; excludes HBM, interposer and substrate. Not wafer-start area. |
| Power | Rated annual equipment-flow GW → installed system IT GW → load/PUE-adjusted TWh | Annual shipments, year-end stock, average facility load and annual electricity are separate. |
| Revenue / tied-up capital | Bits × relevant price; inventory devices × relevant cost | Revenue recognition, raw-HBM/WIP changes and actual purchase prices require their own bridges. Costs here are scenario scales. |
Nominal GB/EB conventions are applied consistently on both sides. The model does not convert one side from GiB to decimal GB while leaving the other unchanged. Two Blackwell/Rubin compute dies still form one GPU; TPU8i Max contains two underlying devices per package without doubling per-device memory. [30][31]
B | Assumptions that determine the result
| Parameter | Base and range | Basis / consequential boundary |
|---|---|---|
| 2025 IT stock | 82 GW global; 25 GW AI / 57 GW conventional | 82 GW is IEA’s estimate; the split is our assumption [36] |
| Facility growth | 20% / 25% / 30% annual global IT growth | 25% is accelerated: ~250 GW in 2030 versus IEA’s external 174 GW forecast. No IEA 2030 forecast is an input [36][37][38] |
| AI readiness / geography | 100% of available incremental IT in base; 85% sensitivity | Power, cooling, network and location must all match. Global fungibility is an optimistic boundary. |
| System overhead / energy | System IT/rated accelerator power 1.45; range 1.25–1.65; new-AI load 0.60 and PUE 1.15 | PUE affects energy, not installable IT capacity. System/rack ratings are not chip TDP [23][45][46] |
| Opening stock / life | 5.672 GW uninstalled; 50% H200 / 50% B200 device-count proxy; new life five years | Not observed inventory. Opening state is identical across policies; legacy AI retires evenly over five years. |
| Procurement | 1/2/4 quarters ahead; one-quarter physical readiness lag | Installation lag is not a unique purchasing rule. Ready equipment can wait in inventory. |
| Future BOM | Constant 24 Gb in base; future 480 GB is a 50/50 population of 384/576 GB configurations | Not an announced 480 GB SKU or 10-Hi product. Forced 32 Gb transition is a separate stress. |
| Memory inventory | Zero net raw-HBM/WIP inventory change in base | Device-embedded memory can proxy covered-device absorption, not total market shipments or revenue. |
| Constraints not solved separately | Logic front-end, CoWoS, substrates and board throughput | A complete process/customer global capacity panel is not available; logic area is a derived demand mapping. |
| 2029–2030 | Explicit continuation paths for capacity, products and procurement into 2031 | Greater long-horizon uncertainty; annual outputs are not validated whole-market point forecasts. |
C | Desired-device path and 2028 configurations
| Year | NVIDIA GPU | Other GPU | Google TPU | Other ASIC | Total / m devices | ASIC share |
|---|---|---|---|---|---|---|
| 2026 | 7.70 | 0.84 | 3.42 | 3.81 | 15.78 | 45.9% |
| 2027 | 9.23 | 1.43 | 6.33 | 6.48 | 23.48 | 54.6% |
| 2028 | 10.16 | 2.01 | 8.86 | 9.08 | 30.11 | 59.6% |
| 2029 | 10.67 | 2.51 | 11.08 | 11.35 | 35.60 | 63.0% |
| 2030 | 10.67 | 3.01 | 13.30 | 13.62 | 40.59 | 66.3% |
This is desired demand before supply, financing and facility constraints, not observed orders. The 2026 reference is backcast from a 2027 public research abstract and growth rates, so it remains an estimate. At constant prices and GPU/ASIC cost ratio 3:1, the 2028 equipment budget must rise 65.7% from 2026. Unit-cost or owned/leased changes require updating the budget bridge. [28]
Named customer programmes explain only part of growth. AWS’s additional two million GPUs are phased over their disclosed delivery interval; Anthropic’s 5 GW is not all Google TPU demand. Residual customer growth remains an assumption. Total hyperscaler capex is not divided by a GPU price. [29][48]
| 2028 product / population | Demand / m | Nominal GB/device | Rated W/device | Logic mm²/device | Power basis |
|---|---|---|---|---|---|
| B300 HGX | 0.122 | 288 | 1100 | 1650 | Disclosed power anchor |
| GB300 NVL72 GPU portion | 0.183 | 288 | 1400 | 1650 | Disclosed power anchor |
| Rubin GPU | 1.910 | 288 | 1800 | 1650 | Engineering power |
| Rubin Ultra architecture branches | 2.865 | 480 | 2800 | 3300 | Engineering power |
| Post-2027 GPU family (unnamed) | 5.079 | 480 | 3200 | 3300 | Engineering power |
| MI450X | 0.301 | 288 | 1800 | 2870 | Engineering power |
| MI455X | 0.502 | 432 | 1800 | 2870 | Engineering power |
| Post-MI400 GPU family (unnamed) | 1.205 | 480 | 2400 | 3200 | Engineering power |
| TPU8t | 1.330 | 216 | 1200 | 1550 | Engineering power |
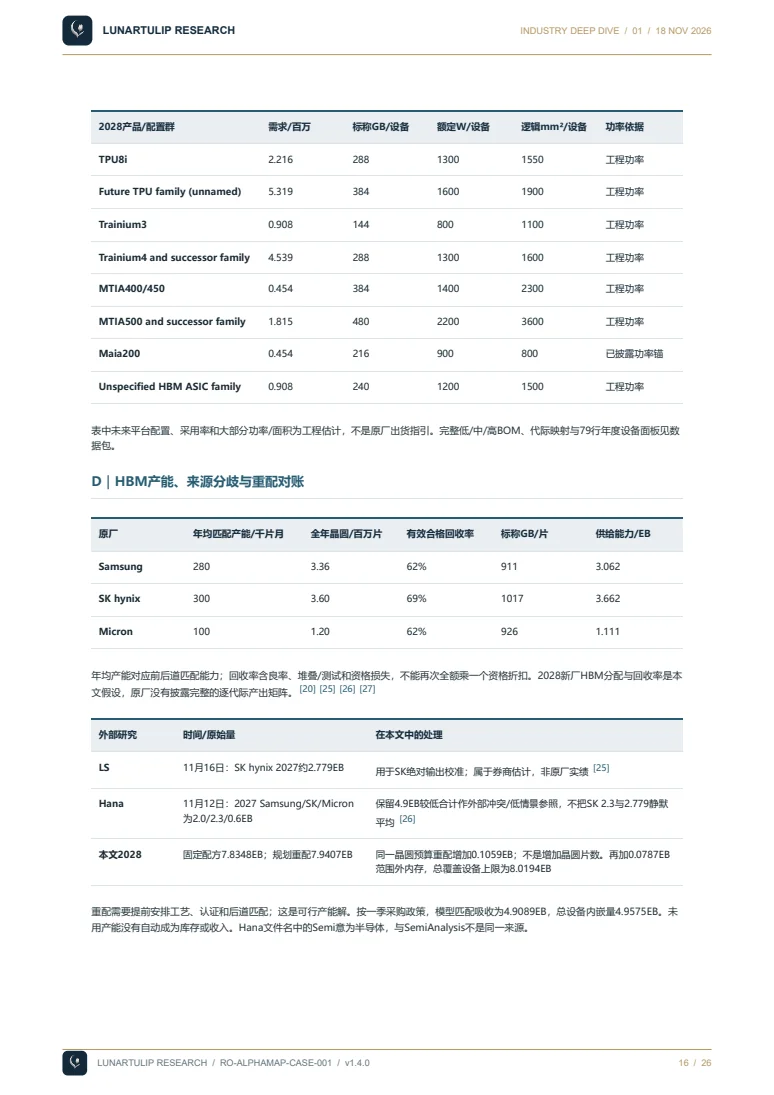
| TPU8i | 2.216 | 288 | 1300 | 1550 | Engineering power |
| Future TPU family (unnamed) | 5.319 | 384 | 1600 | 1900 | Engineering power |
| Trainium3 | 0.908 | 144 | 800 | 1100 | Engineering power |
| Trainium4 and successor family | 4.539 | 288 | 1300 | 1600 | Engineering power |
| MTIA400/450 | 0.454 | 384 | 1400 | 2300 | Engineering power |
| MTIA500 and successor family | 1.815 | 480 | 2200 | 3600 | Engineering power |
| Maia200 | 0.454 | 216 | 900 | 800 | Disclosed power anchor |
| Unspecified HBM ASIC family | 0.908 | 240 | 1200 | 1500 | Engineering power |
Future configurations, adoption and most power/area values are engineering estimates, not vendor shipment guidance. The package includes low/mid/high BOMs, generation joins and the 79-row annual device panel.
D | HBM capacity, source disagreement and reallocation
| Supplier | Average capacity / kwpm | Annual wafers / m | Effective recovery | Nominal GB/wafer | Capacity / EB |
|---|---|---|---|---|---|
| Samsung | 280 | 3.36 | 62% | 911 | 3.062 |
| SK hynix | 300 | 3.60 | 69% | 1017 | 3.662 |
| Micron | 100 | 1.20 | 62% | 926 | 1.111 |
Average capacity is matched front-/back-end capability. Effective recovery includes yield, assembly/test and qualification losses; another blanket qualification discount would double count. 2028 fab allocation and recovery are our assumptions, not a complete issuer-disclosed generation-output matrix. [20][25][26][27]
| External research | Date / original estimate | Treatment here |
|---|---|---|
| LS | Nov 16: SK hynix 2027 ~2.779 EB | SK absolute-output calibration; broker estimate, not issuer actual [25] |
| Hana | Nov 12: 2027 Samsung/SK/Micron 2.0/2.3/0.6 EB | The 4.9 EB total remains an external conflict/low-case reference. SK 2.3 and 2.779 are not silently averaged [26] |
| Our 2028 | Fixed recipe 7.8348 EB; planned reallocation 7.9407 EB | Reallocation adds 0.1059 EB within the same wafer budget. Adding 0.0787 EB outside-pool memory yields an 8.0194 EB covered-device ceiling. |
Reallocation requires process planning, qualification and matching back-end capacity. It is a feasible capacity solution. Under one-quarter procurement, matched absorption is 4.9089 EB and total device-embedded memory is 4.9575 EB. Unused capacity does not automatically become inventory or revenue. “Semi” in the Hana filename means semiconductor; it is not SemiAnalysis.
E | Annual physical outputs, 2026–2030
One-quarter procurement
| Year | Manufactured / m | Embedded HBM / EB | Logic / 000 m² | Rated flow / GW | Year-end AI IT / GW | All DC / TWh |
|---|---|---|---|---|---|---|
| 2026 | 15.34 | 3.494 | 22.31 | 17.26 | 44.27 | 545 |
| 2027 | 14.88 | 4.098 | 25.95 | 21.67 | 68.82 | 683 |
| 2028 | 13.45 | 4.958 | 30.90 | 25.98 | 99.67 | 860 |
| 2029 | 15.49 | 6.095 | 37.56 | 31.81 | 138.50 | 1075 |
| 2030 | 20.74 | 8.193 | 50.00 | 42.14 | 187.31 | 1346 |
Four-quarter procurement
| Year | Manufactured / m | Embedded HBM / EB | Logic / 000 m² | Rated flow / GW | Year-end AI IT / GW | All DC / TWh |
|---|---|---|---|---|---|---|
| 2026 | 15.78 | 3.592 | 22.93 | 17.75 | 44.36 | 545 |
| 2027 | 22.03 | 6.067 | 38.42 | 32.08 | 68.82 | 684 |
| 2028 | 19.83 | 7.311 | 45.58 | 38.32 | 99.67 | 860 |
| 2029 | 18.07 | 7.112 | 43.83 | 37.11 | 138.50 | 1075 |
| 2030 | 29.07 | 11.486 | 70.09 | 59.08 | 187.31 | 1346 |
Both tables hold 25% facility growth, mid power, one-quarter physical lag and opening inventory fixed. The one-quarter policy produces ~166,719 m² cumulative logic area in 2026–2030. Its 2030 rated equipment flow of 42.14 GW, installed AI IT of 187.31 GW, all-DC IT of 250.24 GW and 1,346 TWh answer different questions; a single 34% comparison cannot be applied to all of them.
IEA’s external 2030 forecast is approximately 174 GW of all-DC IT, 226 GW rated facility capacity and 945 TWh. Our accelerated path is not reverse-fitted to those forecasts. Lower growth paths can be checked directly. Unannounced products and continuing HBM process/capacity assumptions materially affect 2029–2030. [36]
F | Inventory and financing: flows do not replace stocks
| Lookahead / q | Annual embedded / EB | Uninstalled / m | Inventory HBM / EB | Inventory IT / GW | Installed AI IT / GW |
|---|---|---|---|---|---|
| 1 | 4.9575 | 3.618 | 1.334 | 10.138 | 99.667 |
| 2 | 5.2124 | 7.424 | 2.737 | 20.802 | 99.667 |
| 4 | 7.3111 | 15.643 | 5.767 | 43.829 | 99.667 |
Four quarters versus one adds 2.3536 EB of annual procurement, but 4.4331 EB and 12.0244 million devices to year-end inventory. Flow and stock are not interchangeable. Equal commissioned GW also does not require identical installed device cohorts or HBM.
| Assumed ASIC price | Assumed GPU price | Extra year-end accelerator capital / $bn |
|---|---|---|
| $5,000 | $15,000 | 108.7 |
| $10,000 | $30,000 | 217.4 |
| $15,000 | $45,000 | 326.1 |
Prices are normalised assumptions at GPU:ASIC=3:1. Extra inventory is approximately 4.8588 million GPUs and 7.1656 million ASICs. Tied-up capital is not annual incremental capex, committed financing, net debt or market-value impact.
G | Company financial transmission and falsifiers
| Company / relationship | Financial exposure | Transmission gate and evidence |
|---|---|---|
| Samsung / Micron | 2027 delivery/pricing; returns on 2028 expansion | Negotiated volume/pricing improve visibility; cancellation, delivery and inventories still matter [20][42] |
| NVIDIA → CoreWeave | Equipment/service delivery, funding costs and capex timing | Specified residual-capacity purchases have performance conditions; not a guarantee of all company debt [2] |
| AMD / unnamed Neocloud → CORZ | Future customer mix, construction financing and lease start | 377 MW AMD direct leases plus 152 MW third-party leases; specified conditional AMD support applies to the latter. Neither group had commenced at September-end; current colocation revenue was still 100% CoreWeave. 590/(590+530), about 53%, is a future capacity share [6][7][49] |
| CoreWeave → APLD / CORZ | Construction spend, lease start, cash receipts and debt coverage | Project funding, acceptance, billing and advance credits; a customer’s stock decline does not automatically reduce rent [6][7][9][10] |
| Microsoft → CRWV / NBIS / IREN | Common budget, delivery and collection concentration | Deduplicate overlapping capacity/workloads only. IREN’s Microsoft DDTL has four tranches and conditions precedent [3][12][13][14] |
| Google → Akela / Fluidstack | Lease credit risk, protection and WULF dilution | Lease/default conditions and termination-fee/assumption choice; not blanket construction protection [11] |
| Broadcom → SPV → Anthropic | ASIC delivery, equipment leasing and residual support | The $63bn financing commitment does not establish that the full amount has been drawn. Broadcom’s support equals first-lien loans, not an unconditional guarantee of the entire sum [39] |
| NVIDIA → SB Energy / OpenAI | Conditional project support and future support choices | 4.25 GW IT / nine phases / $105bn guarantee cap; lease-start and specified-default triggers. Another 3.8 GW is discretionary [19] |
The incremental leadership effect requires new orders, amendments, support choices or changed financing terms. No unsupported global cancellation haircut enters the base; this does not prove a zero event effect. Prior power delays or Q3 refundability changes cannot be attributed to November 12. [1][3][19]
| Channel | Observable evidence | Inference limit |
|---|---|---|
| Expectations | Earnings estimates, financing quotes, valuations and event times | Co-declines do not establish contractual cash loss |
| Financing | Collected advances, restricted cash, drawability, alternatives and payment calendar | Commitments are not spendable cash |
| Operations | Delivery/acceptance, lease start, credits and collections | Count a root event once across paths; no short-return backtest is claimed |
H | Distinct identities of the two SemiAnalysis materials
| Material | Available information | Treatment |
|---|---|---|
| Older Nov13 vs Nov2 charts [16] | 2028 HBM 9.0→6.4 EB; displayed 2026–30 area series; 2030 power 122.8→80.7 GW | Old displayed-value arithmetic only. Power scope pending; not a baseline for the newer report. |
| Separate Nov17 report [18] | Separately supplied headline: cumulative area −17%, 2028 HBM −30%, 2030 power −34% | Verifiable original, levels and previous baseline not obtained; identity remains distinct. |
| Our frozen model | 2028 capacity ~7.8 EB; policy procurement 5.0/5.2/7.3 EB; constant-device configuration change 2.8% | No external revision/baseline input. Exact-magnitude adjudication remains incomplete pending a common perimeter. |
A forecast cut is relative to an earlier forecast, not necessarily a year-on-year decline. GPU share loss, ASIC growth, lower memory per device and power-efficiency changes can coexist with different magnitudes. Absolute levels and driver decompositions require separate comparison.
I | Retained project cash and debt exhibits
This appendix retains the previously verified cash/contract modules: CoreWeave cash coverage and Core Scientific billing, advance credits and a specific debt schedule. They explain company differences without replacing a global hardware model.


The CORZ debt illustration uses a 7.75% coupon, $3.3bn principal and initial annual amortisation of 11.5%. The assumed first instalment on November 15, 2029 depends on relevant lease commencement, credit exhaustion and a qualifying payment date. It is not a complete company free-cash-flow forecast. [7][8]
J | Relationship-to-source mapping
| From | Relationship | To | Provenance |
|---|---|---|---|
| NVIDIA | GPU supply | CoreWeave | Existing AlphaMap [3] |
| CoreWeave | Compute service | Microsoft | Existing AlphaMap [3] |
| CoreWeave | Compute service | OpenAI | Existing AlphaMap [3] |
| Nebius | Phased GPU service | Microsoft | Existing AlphaMap [12][13] |
| IREN | Phased GPU service | Microsoft | Existing AlphaMap [14][15] |
| Applied Digital | Project hosting | CoreWeave | Existing AlphaMap [9][10] |
| TeraWulf | Indirect subsidiary | Akela | Existing AlphaMap [11] |
| Akela | Project leases | Fluidstack | Existing AlphaMap [11] |
| Conditional credit support | Akela | Existing AlphaMap [11] | |
| TeraWulf | Warrant consideration | Existing AlphaMap [11] | |
| NVIDIA | Conditional residual-capacity purchase | CoreWeave | Public supplement [2] |
| Core Scientific | Project hosting | CoreWeave | Public supplement [6][7][8] |
| IREN | Cloud-services customer contract | NVIDIA | Public supplement [14] |
| SK hynix | Memory supply | NVIDIA | Existing AlphaMap [44] |
| Micron | Memory supply | NVIDIA | Existing AlphaMap [44] |
| SK hynix | HBM4 base-die cooperation | TSMC | Existing AlphaMap [43] |
| Broadcom | Residual support = first lien | Financing SPV | Public supplement [39] |
| Broadcom | XPU / networking supply | Financing SPV | Public supplement [39] |
| Financing SPV | Equipment leasing | Anthropic | Public supplement [39] |
| Core Scientific | 377 MW direct lease / pending | AMD | Public supplement [6][7][49] |
| Core Scientific | 152 MW lease / pending | Undisclosed Neocloud | Public supplement [6][7][49] |
| AMD | Conditional support: 152 MW only | Core Scientific | Public supplement [49] |
Thirteen existing relationships guide discovery, with nine public supplements for current contracts and supply structure. Arrows represent service, goods, ownership or support, not a universal cash direction. Path counts do not generate return correlations or probabilities. No production AlphaMap write is claimed.
Sources and definitions
- NVIDIA CEO transition2026-11-12 · Corporate announcement
- CoreWeave: NVIDIA capacity-purchase arrangement2025-09-15 · Form 8-K; specified residual capacity, through April 13, 2032
- CoreWeave Q3 2026 Form 10-Q2026-11-10 · Cash-flow statement: nine months ended September 30, 2026; named customers
- CoreWeave Q3 2026 results2026-11-10 · Results release
- CoreWeave Q3 2026 earnings call2026-11-10 · PDF pages 2 and 6; expected customer prepayments/deposits, not receipts
- Core Scientific Q3 2026 presentation2026-11-05 · Slides 4, 6, 9–13; leased and billable IT capacity, AMD-associated delivery expectations, CoreWeave contract book and construction credits
- Core Scientific Q3 2026 Form 10-Q2026-11-05 · Notes 6–7 and MD&A; uncommenced AMD-associated leases, current CoreWeave customer concentration, construction financing and contingent debt schedule
- Core Scientific Finance I LLC indenture2026-05-06 · Sections 4.23 and 14.01; principal and cash-use conditions
- Applied Digital Q1 FY2027 results2026-10-07 · Polaris Forge 1 delivery and completed project-note issuance
- Applied Digital FY2026 Form 10-K2026-07-29 · CoreWeave hosting scope and legal entities
- TeraWulf Q3 2026 Form 10-Q2026-11-06 · Akela/Fluidstack leases, Google recognition agreements and warrants
- Nebius Q3 2026 shareholder letter2026-11-12 · Microsoft NJ deployment schedule; companywide funding expectations
- Nebius Microsoft agreement summary2025-09-08 · Form 6-K; financing, phased delivery, grace period and alternative capacity
- IREN FY2026 Form 10-K2026-08-27 · Microsoft tranche prepayment/credit terms; NVIDIA cloud-services contract
- IREN Q1 FY2027 results2026-11-05 · Horizon rollout; scope and conditions of funding statements
- SemiAnalysis Accelerator Model: supplied comparison charts2026-11-13 model / 2026-11-02 previous version · Displayed chart values supplied to LunarTulip; circulated November 17. Original institutional report and underlying Excel not obtained. Calculations use displayed rounded values, not independently calibrated forecasts.
- SemiAnalysis Accelerator & HBM Model: official methodologyAccessed 2026-11-17 · Official model methodology and scope, not the underlying data for this revision
- Separate SemiAnalysis November 17 report: user-supplied headline summary2026-11-17, identified by user; original pending · Distinct from source 16. User reports -17% cumulative 2026–2030 accelerator logic area, -30% 2028 HBM, -34% 2030 data-centre power. Original text, baseline, metric perimeter and model inputs not yet obtained. No original-report audit claimed.
- NVIDIA Q2 FY2027 commitments and guarantees2026-08-26 filing; July 26 balances and August subsequent event · AI cloud service agreements, SB Energy/OpenAI conditional guarantees and optional further support; fiscal years
- Micron Q4 FY2026 prepared remarks2026-09-30 · Industry DRAM bit outlook, contracted 2027 HBM and capex-to-output lag; company expectations
- Microsoft FY2027 Q1 earnings call2026-10-28 · Customer demand, capital spending and third-party delivery timing; company CapEx includes finance leases
- Alphabet Q3 2026 earnings call2026-10-28 · 2026 cash capital spending guidance; server/network versus building mix; company outlook
- NVIDIA DGX B300 specificationsAccessed 2026-11-17 · Eight GPUs, reported 2.1 TB GPU memory, approximately 14 kW system power; hardware-equivalent illustration
- CoreWeave Vera Rubin MLPerf announcement2026-11-16 · Post-transition execution evidence in Available category; not a funding or all-roadmap guarantee
- LS Securities: SK hynix forecast and quarterly TSV model2026-11-16 · Original broker estimates, PDF p3. 2026/27 HBM2.117/2.779 nominalEB and annual processing2.205/2.85m wafers. Estimates, not issuer-reported actual output.
- Hana Securities: semiconductor industry capacity study2026-11-12 · Original broker estimates, printed p25. Supplier capacity paths and new-DRAM-fab scale. Filename Semi means semiconductor, not SemiAnalysis. Capacity timing and HBM allocation are modeled separately.
- Samsung Securities: HBM wafer geometry2026-06-02 · Printed p19 engineering estimates for dies per wafer and effective recovery; not measured factory yields.
- DIGITIMES: high-end cloud AI accelerator shipments2026-10-19 · Public original-publisher abstract anchors a backcast2026 estimate. Full paid report/count dictionary not accessed; 2026 is not an observed actual. Our forward growth assumptions are separate.
- NVIDIA Q2 FY2027 earnings call2026-08-26 · AWS additional2mGPUs over the stated multi-year period; no calendar-year delivery schedule. Revenue opportunity perGW includes multiple products, not a GPU ASP.
- Google TPU8t and TPU8i technical deep dive2026-04-22 · Official capacity/specification definitions. Neither customer counts nor model availability establishes annual chip shipments.
- NVIDIA Rubin architecture2026-07-21 · Two compute dies form one logical GPU; regularRubin288GB12Hi remains separate from unfinalizedUltra configurations.
- AMD MI450X specifications2026-11-12 · 288GB with8HBM stacks. Compare withMI455X432GB/12stacks; this is stack-count selection, not automatically an8Hi layer change.
- AMD MI455X specifications2026-07-23 · 432GB and12HBM stacks. Product choice is modeled at constant device count for the configuration bridge.
- TrendForce: Rubin Ultra configurations under evaluation2026-08-04 · Configuration and validation discussion predates the November CEO event. Does not confirm finalUltra architecture or adoption rate.
- TrendForce: HBM layer-count pricing2026-09-29 · 2027 forecast of8Hi10–20%per-Gb premium vs12Hi. Used as a constant-scope revenue sensitivity, not a2028 executed price.
- IEA Key Questions on Energy and AI, Table A.12026-04-16 · 2023/24/25IT capacity57/68/82GW initializes the historical stock. IEA2030 forecast is an external check, never an independent-model input. IT, facility rating, average load and annual energy differ.
- CBRE North America Data Center Trends H1 20262026-08-27 · Eight primaryNA markets: operating10.903GW,33.7%YoY; construction7.481GW. Selected-market scope cannot prove global25%growth.
- JLL North America Data Center Report Midyear 20262026-08-11 · 66GW under construction,95%precommitted. Construction and absorption are not commissioned power; do not add to narrowerCBRE coverage.
- Broadcom / financial partners: Anthropic financing structure2026-10-26 · 63bnUSDSPV transaction with committed financing, deliveries from2027. Broadcom residual-value support equals the first-lien portion; no claim all funds already drawn.
- NVIDIA AI compute financing platform memoranda2026-08-10 · MOU structure aiming to mobilize500bnUSDthird-party capital over time, subject to definitive agreements. Neither NVIDIAcash nor already funded GPU orders.
- SK hynix Q3 2026 results2026-10-28 · HBM4 ramp and M15X timing; more-than50%2027–28LTAcoverage concerns total capacity, not HBM-only volume.
- Samsung Q3 2026 earnings call2026-10-29 · 2027HBMallocation and agreed target prices; HBM4revenue mix is not wafer/bit mix. No published company-level HBMprofit floor.
- SK hynix / TSMC HBM4 cooperation2024-04-19 · Base-die and packaging cooperation; relationship existence does not establish annual customer allocation.
- NVIDIA FY2026 Form10-K: manufacturing and memory suppliers2026-02-25 · Names memory suppliers includingSKhynix,Micron,Samsung; generic supply relationship does not prove qualification for every generation.
- NVIDIA DGX Rubin NVL8 system specificationavailable2026-11-17 · 8GPUs and approximately24kW system power. System scope is distinct from acceleratorTDP and wholefacility capacity.
- Intel Foundry power-delivery white paper2026-08 · Original Intel analysis offers power-scaling estimates. Not an NVIDIA TDP disclosure; used only as engineering cross-check.
- Microsoft Maia multigigawatt deployment plan2026-10-12 · 96accelerators/167kWrack concernsMaia300. Do not attach this rack ratio toMaia200. Multi-GW deployment starts2027; annual mix is not disclosed.
- Anthropic / Google / Broadcom compute update2026-05-06 · 5GW agreement begins coming online2027. Calendar phasing is analyst-assumed; do not add the3.5GWsubset again.
- Core Scientific Q2 2026 Form 10-Q: AMD direct leases and Neocloud credit support2026-07-28 · Note 15 subsequent events: July 27 execution. AMD directly leases 377 MW; a separate Neocloud leases 152 MW under lease-specific AMD credit support, including equipment protections, optional cure rights and specified material-default provisions. The 1,925 MW reservation right is not included in contracted capacity. Filing date verified on the issuer IR filing page as July 28, not the June 30 period-end.
- NVIDIA Q3 FY2027 financial results2026-11-17 US / 2026-11-18 Beijing · Revenue, data-center revenue, Rubin shipments; Q4 guide includes an additional week and assumes no China Data Center compute revenue.
- NVIDIA Q3 FY2027 management earnings-call transcript2026-11-17 US / 2026-11-18 Beijing · Management speech transcribed by Quartr: FY2028 growth outlook, financing clarification, allocation, CPO, and capital priorities; third-party transcript of primary speech.
- NVIDIA Q3 FY2027 CFO Commentary2026-11-17 · Pages 2-5: China revenue; Oct25 supply commitments, Neocloud conditions and guarantees. These are pre-transition quarter-end balances. Furnished EX99.2, 8-K accession 0001045810-26-000088; 10-Q not yet filed.
- NVIDIA expands commitments with supply-chain partners2026-11-17 · Kinsus substrate expansion, Amkor prepayments, SPIL advanced packaging; announcement and planned ramp dates, not completed capacity.
- NVIDIA export-control oversight committee announcement2026-11-17 · Board-level national-security and export-control oversight; no assertion about new laws or license outcomes.
- NVIDIA introduces Nemotron for Science2026-11-16 · Post-transition product announcement; supports current activity in open scientific models, not a quantified long-term spending or sales guarantee.